Spring Application Observability using Prometheus and Grafana


TLDR: In this tutorial we will generate prometheus metrics for a spring boot application and visualize them in a Grafana dashboard.
What is Observability 🤓 ?
Observability in a Spring Boot app is like having a superpower to peek into what's going on under the hood. It's not just about monitoring; it's about knowing how your app is doing in real-time.
We're talking about keeping an eye on stuff like response times, error rates, and what your app is up to behind the scenes.
What brings us to Prometheus and Grafana - a dynamic duo for adding this superpower to your Spring Boot app.
What are Prometheus and Grafana ?
Prometheus is a monitoring and alerting tool that collects and stores time-series data, providing insights into application performance.
Grafana is a visualization platform that turns this data into interactive, customizable dashboards, allowing users to easily analyze and monitor various metrics.
Need to learn more about them, Go here: https://prometheus.io , https://grafana.com
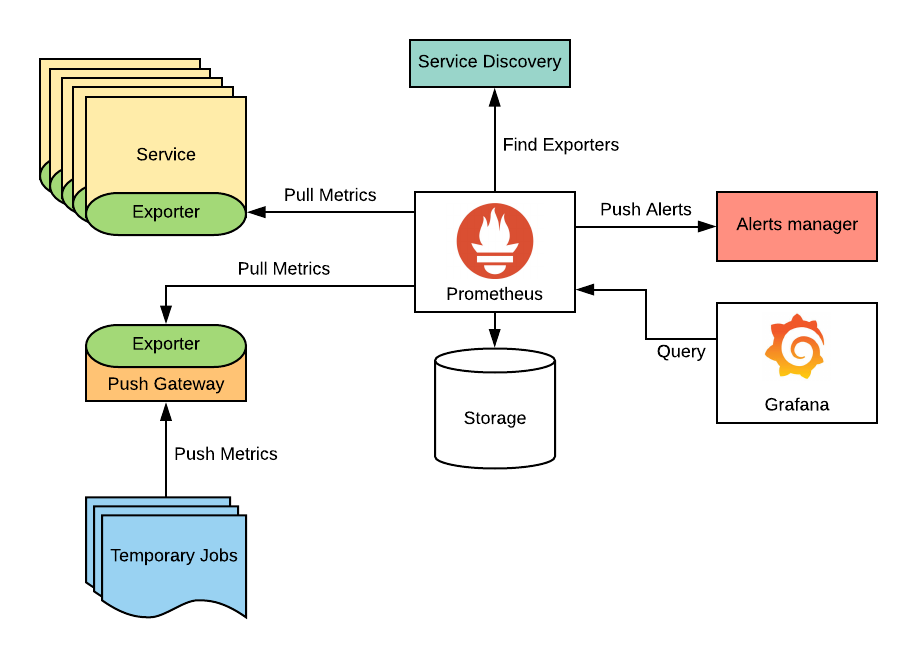
How does prometheus work?
Prometheus work by collecting metrics from various sources and storing them in his time-series database then giving you a powerfull api to search this data to visualise it using tools like Grafana.
Prometheus fetches metrics from Exporters and push Alerts to various mediums, in this tutorial we will use Spring boot actuator generated metrics and we will use micrometer-registry-prometheus package to present the metrics in prometheus format
An exporter is simply a tool that fetches metrics and exposes them on an http endpoint (where prometheus will be able to fetch them)
How does Grafana work
In simple words, Grafana is a visualization tool, it fetches the metrics from various sources, in our case it will fetch them from Prometheus HTTP API /api/v1/query then creates very customizable visualizations.
Enough theory Einstein , show me the code
Tutorial prerequisites
Make sure you have Docker installed (we will use it to install Prometheus and Grafana) and you have Java 17 installed for the example project.
Generate a simple Spring boot application with prometheus metrics exporter
For the purpose of this tutorial we will generate a simple spring boot application using Spring Initializr:
The project used can be generated using this Spring initializr configuration: Link to Spring Initializr
Add the following to your application.properties
# Application name
spring.application.name=spring-app-metrics
# Application Port
server.port=10000
# Export all metrics
management.endpoints.web.exposure.include=*
# Set tags that will be used by the Grafana dashbord
# Application name and applicatio instance
management.metrics.tags.application=${spring.application.name}
management.metrics.tags.instance=${spring.application.name}:${spring.application.instance_id:${random.value}}
Make sure you have these two dependencies in your build.gradle file.
dependencies {
    implementation 'org.springframework.boot:spring-boot-starter-actuator'
    runtimeOnly 'io.micrometer:micrometer-registry-prometheus'
}
Run the spring boot application
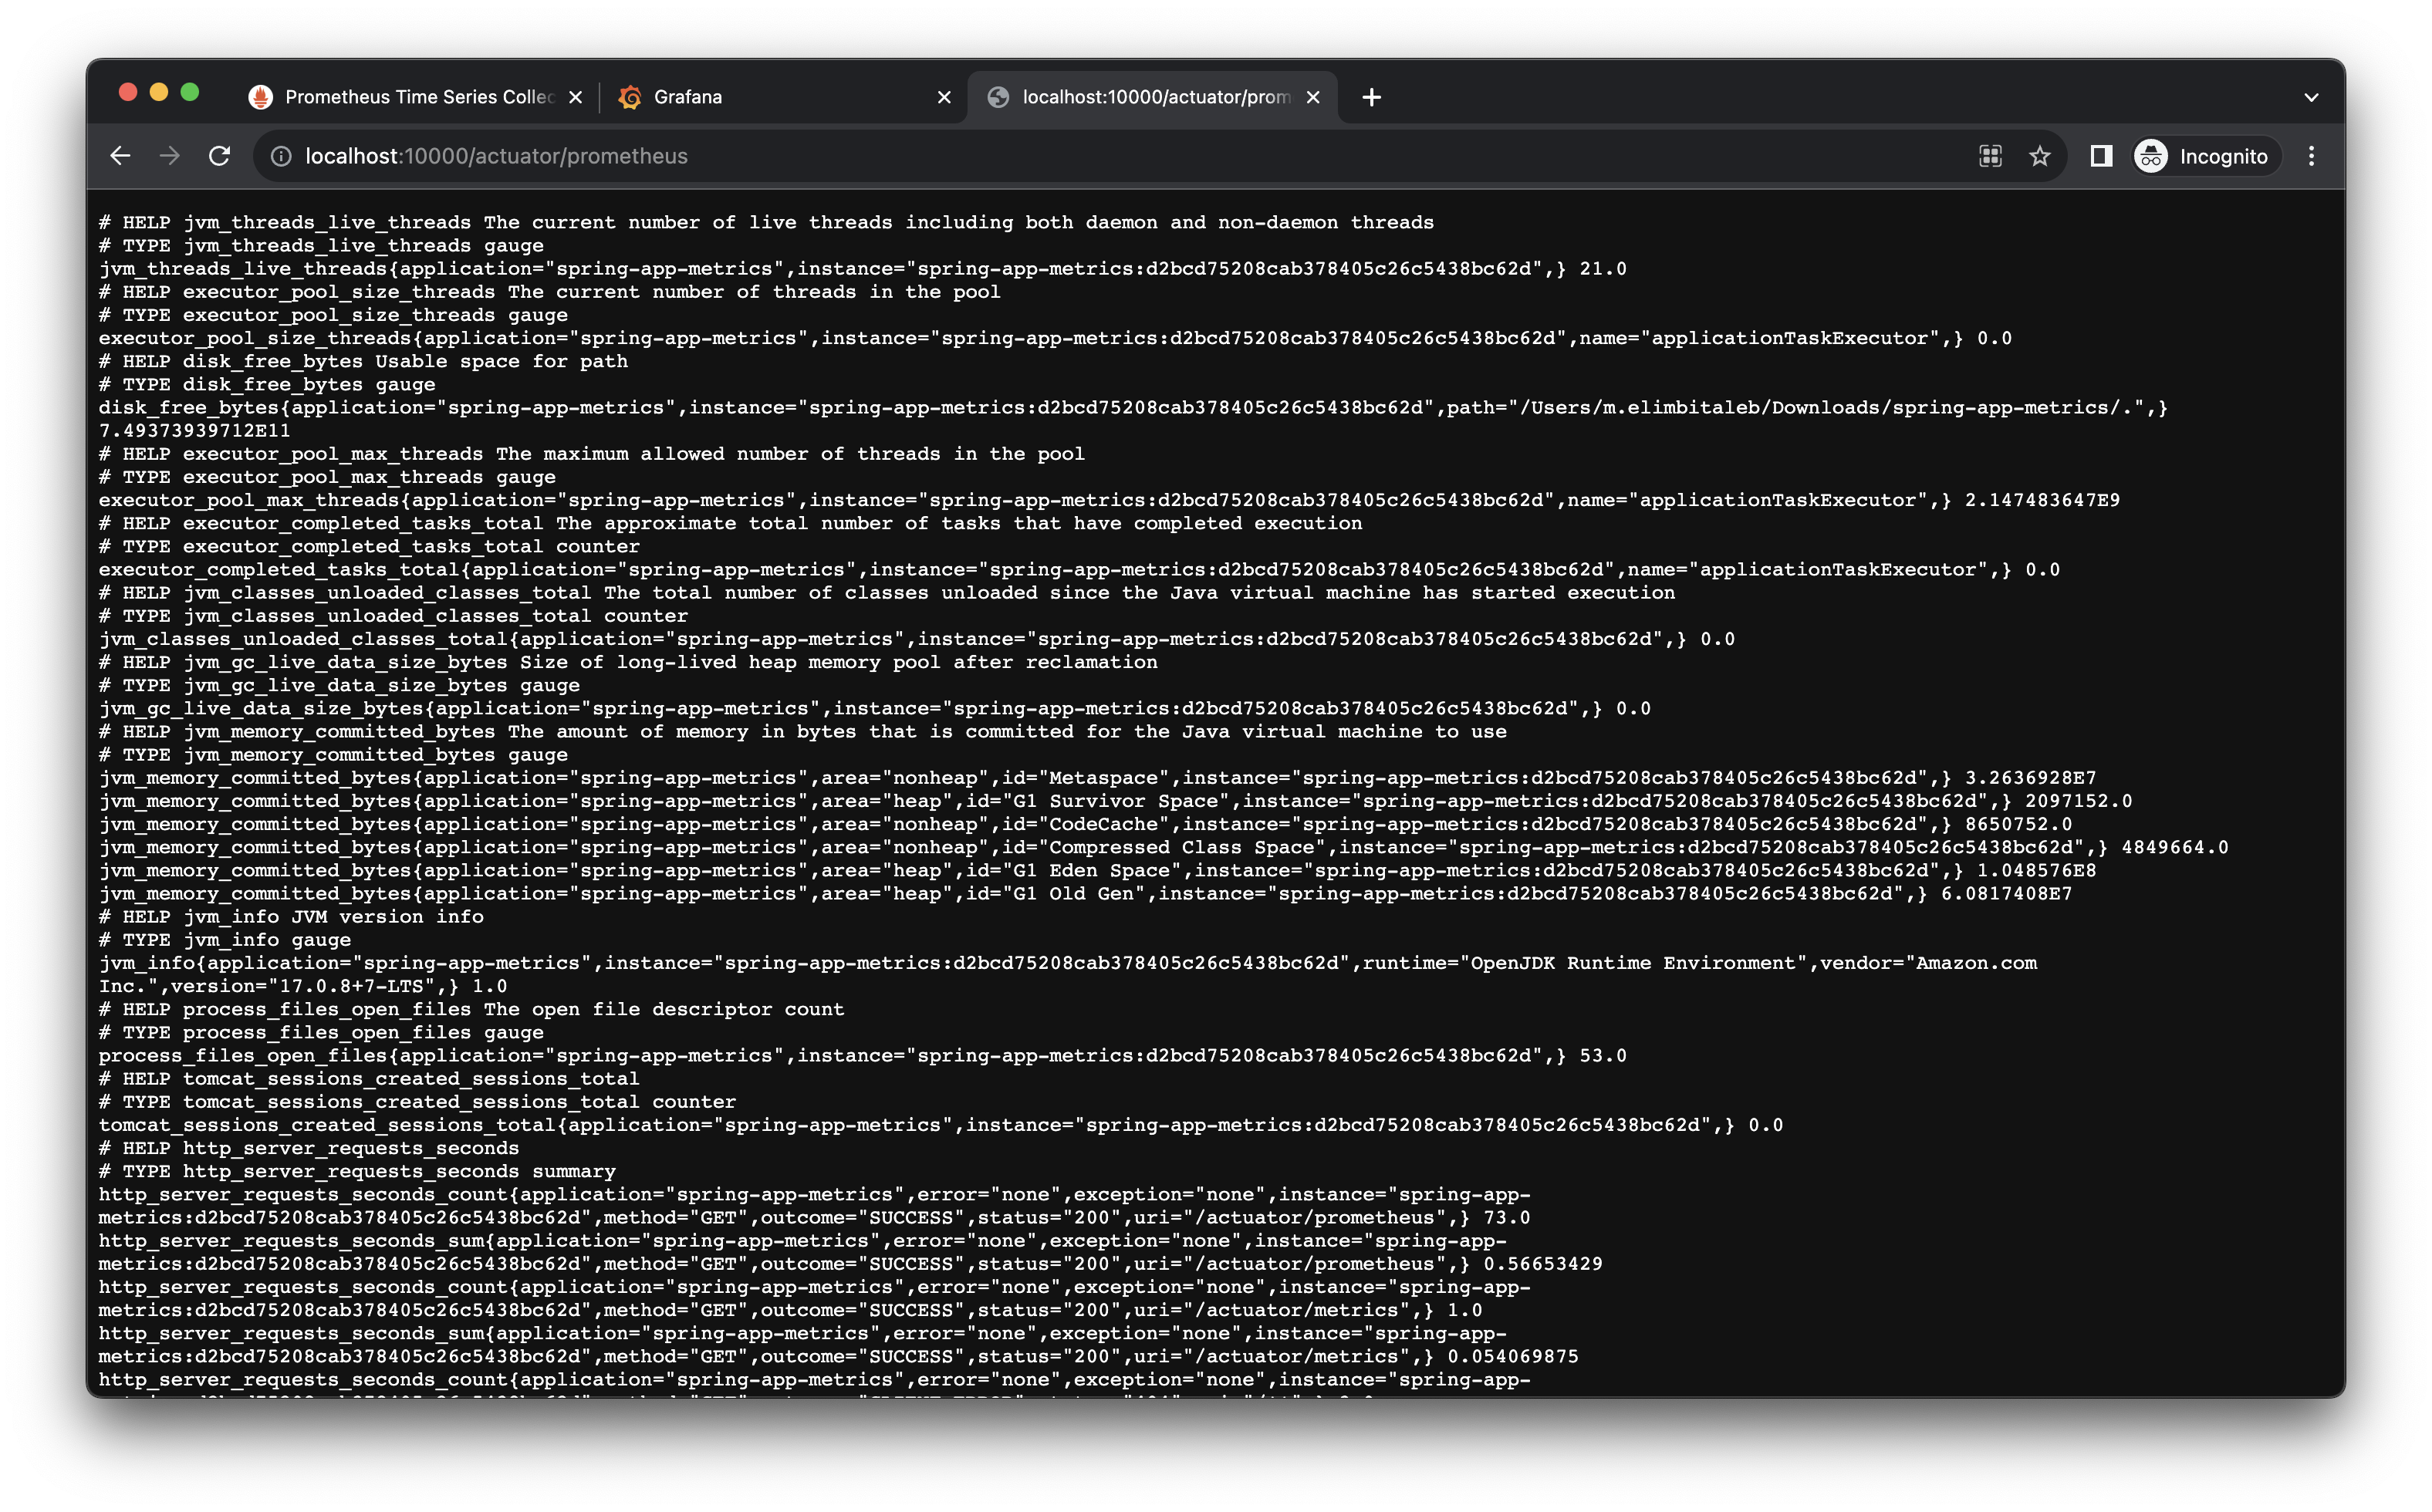
./gradlew bootRunAccess the metrics endpoint to check that prometheus metrics are generated
http://localhost:10000/actuator/prometheus
You should see something like this
Install Prometheus and Grafana using Docker
Fetch Prometheus and Grafana Docker images
docker pull prom/prometheus
docker pull grafana/grafana
Create Container prom1 and graf1
Create prometheus configuration
Create a file prometheus.yml
global:
  scrape_interval:     10s
  evaluation_interval: 10s

scrape_configs:
  - job_name: 'spring-boot-app'
    metrics_path: '/actuator/prometheus'
    # Fetch metrics every 10 seconds
    scrape_interval: 10s
    static_configs:
      - targets: ['host.docker.internal:10000']

# We are using host.docker.internal to access the spring boot application from inside the docker container
# in a real life scenario you will use the IP adress or domain name where the spring boot application is deployed
Create Prometheus and Grafana containers
docker run -d --name prom1 -v ./prometheus.yml:/etc/prometheus/prometheus.yml --publish 9090:9090 prom/prometheus
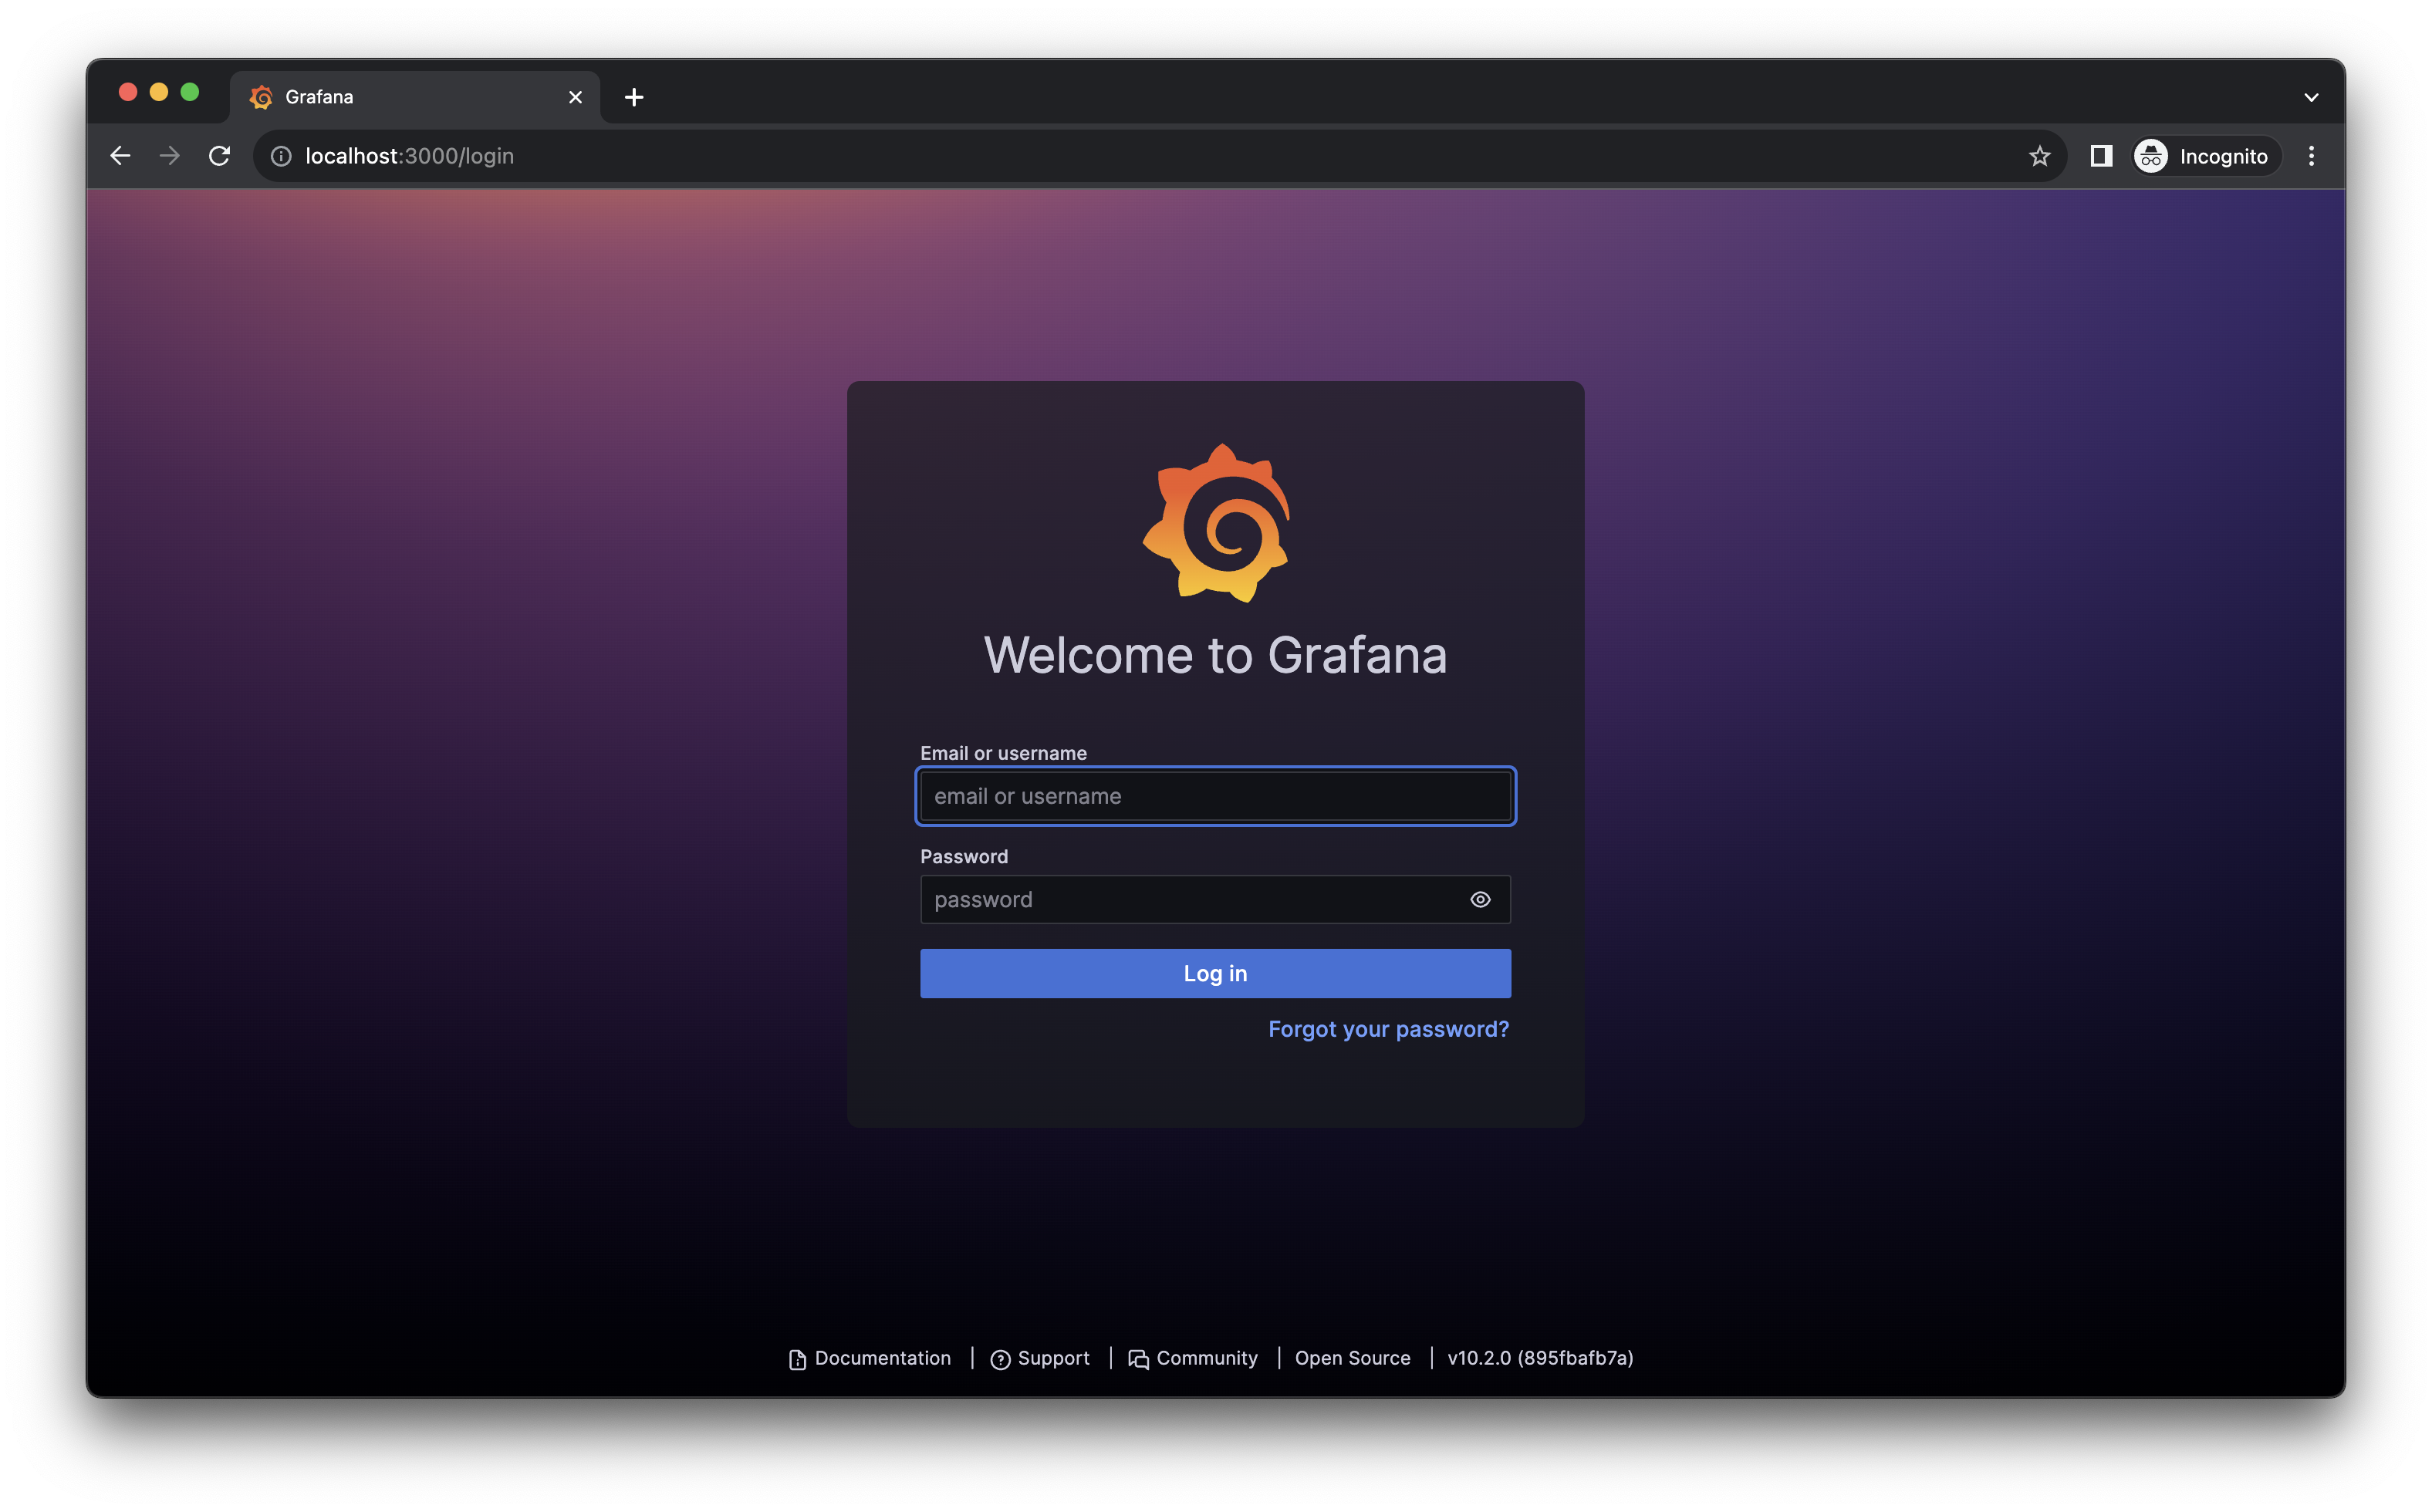
docker run -d --name graf1 --publish 3000:3000 grafana/grafanaWe should have Grafana running on port 3000
You can login with user: admin and password: admin
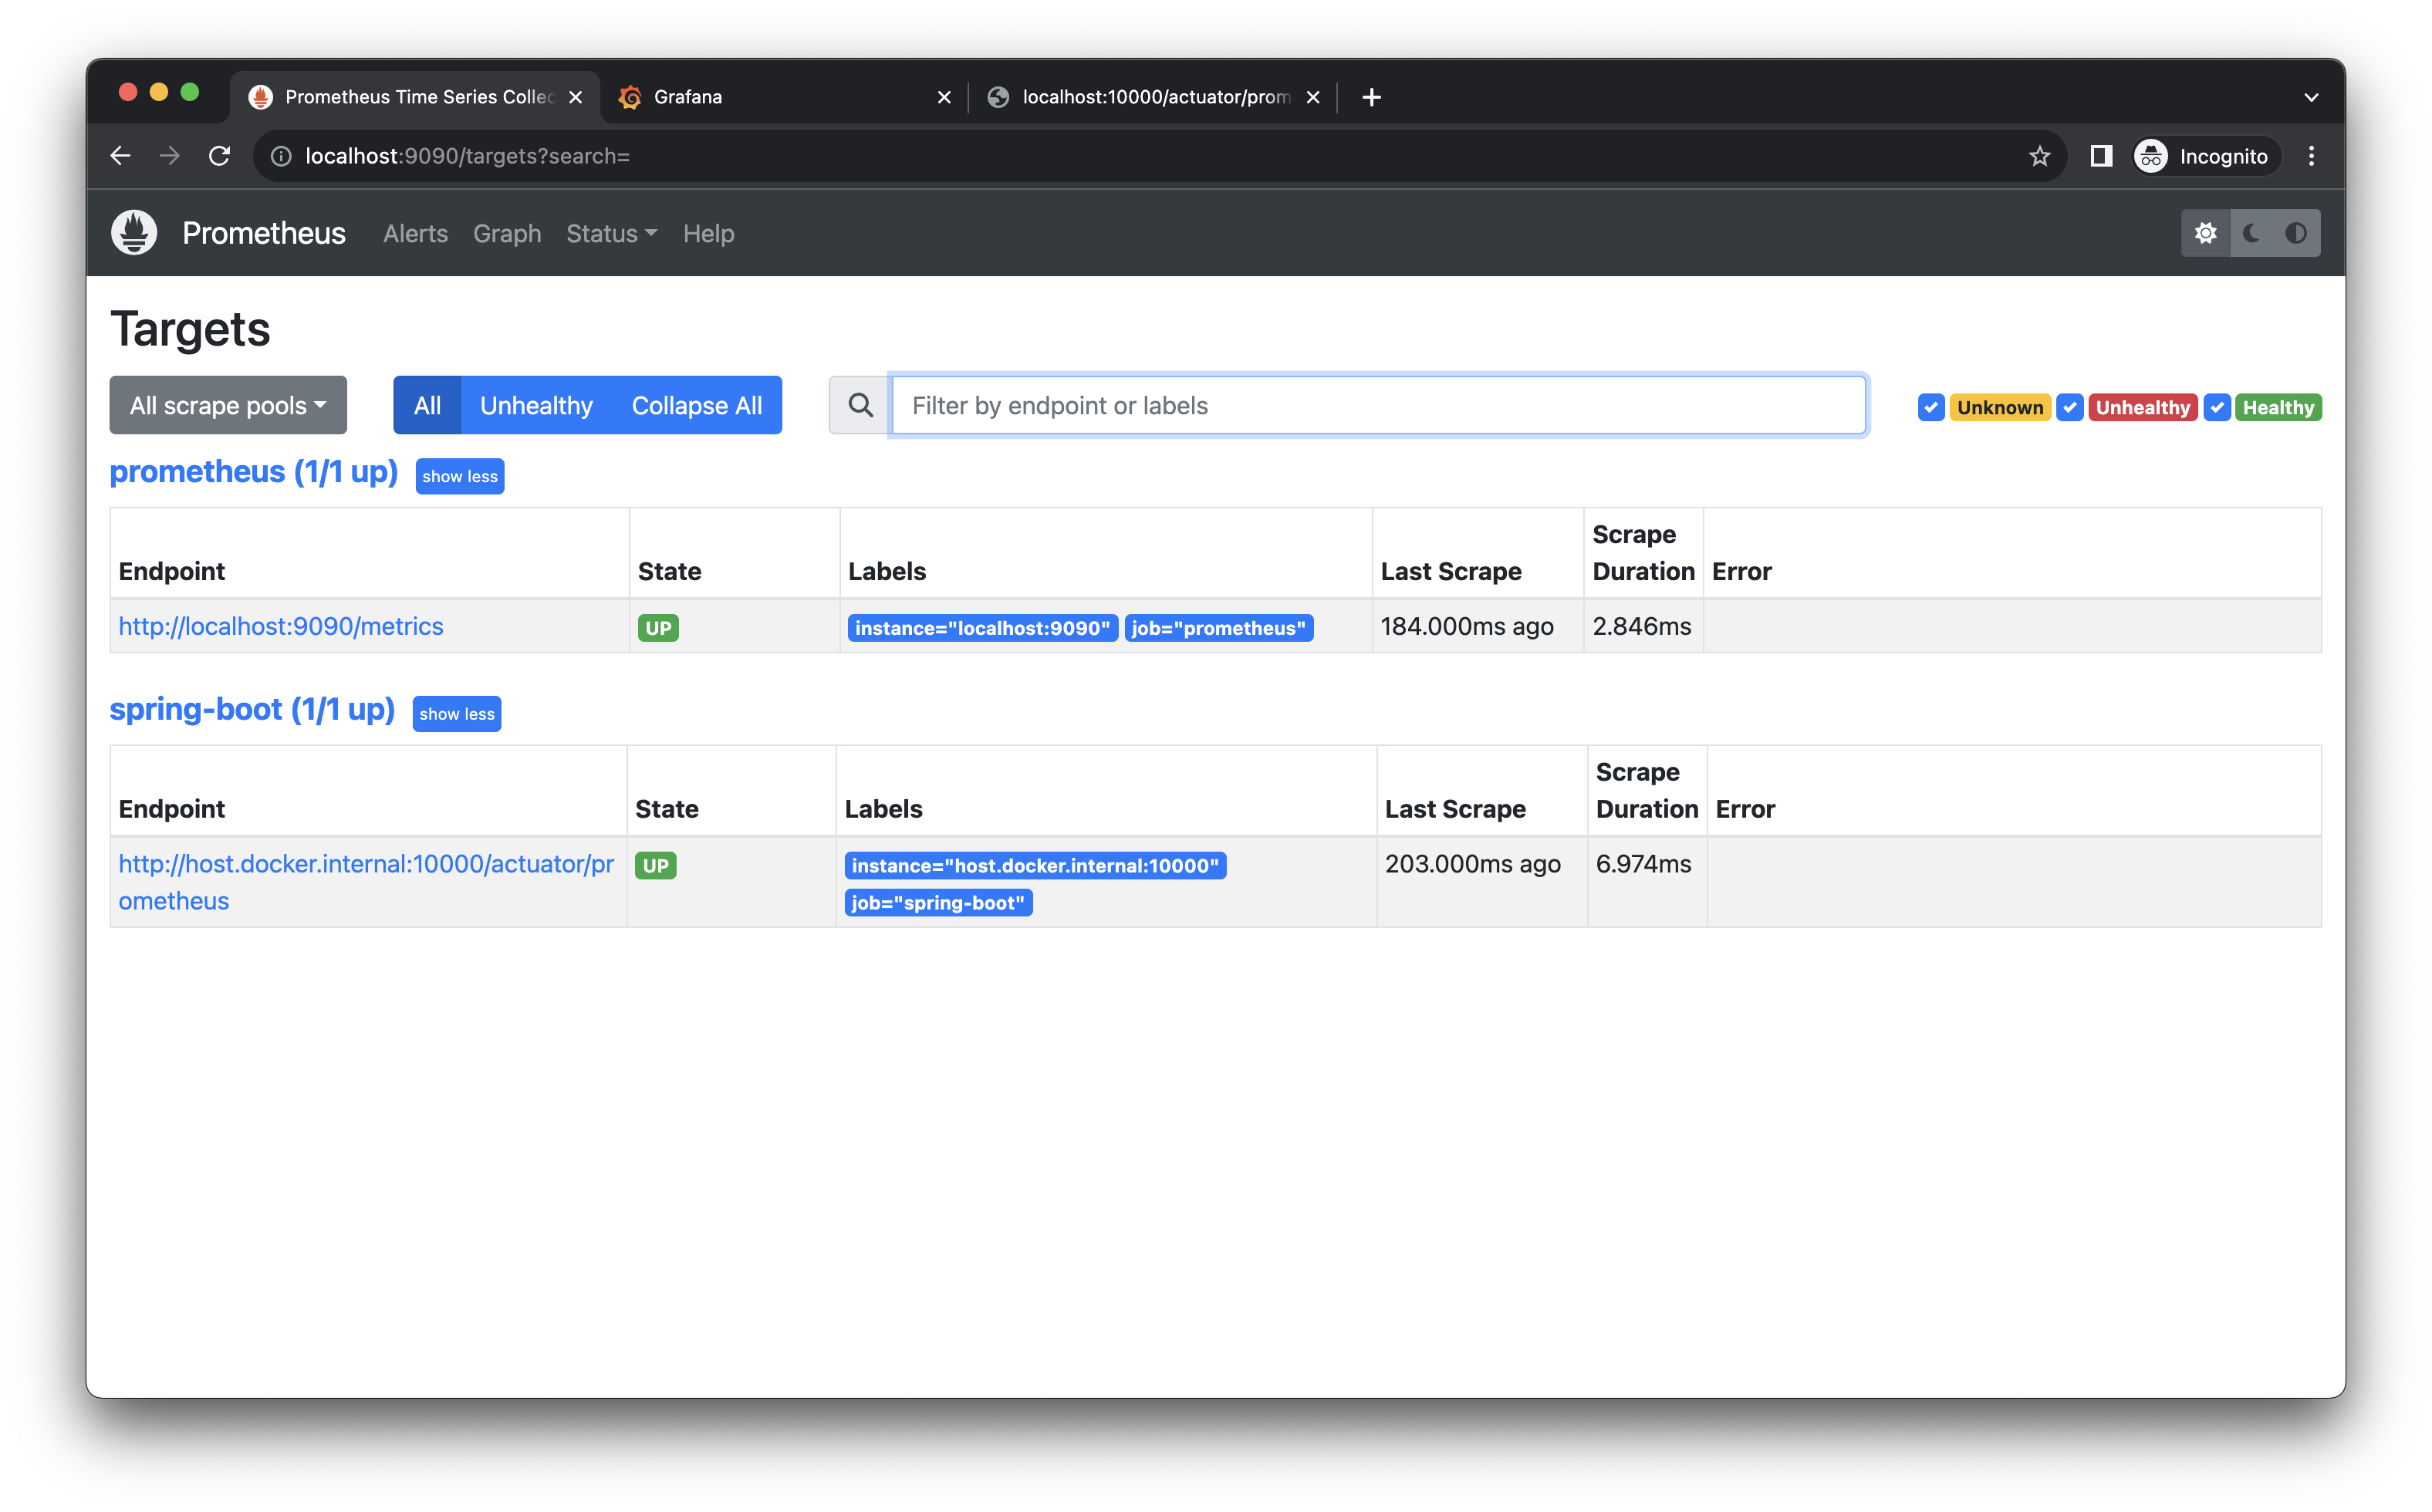
And Prometheus running on port 9090
Access http://localhost:9090/targets and make ur the spring-boot target is 1/1 UP.
Than means that prometheus is collecting metrics from your spring boot app.
After making sure metrics are being pulled from our spring boot up, we can now go to Grafana to create our dashboard
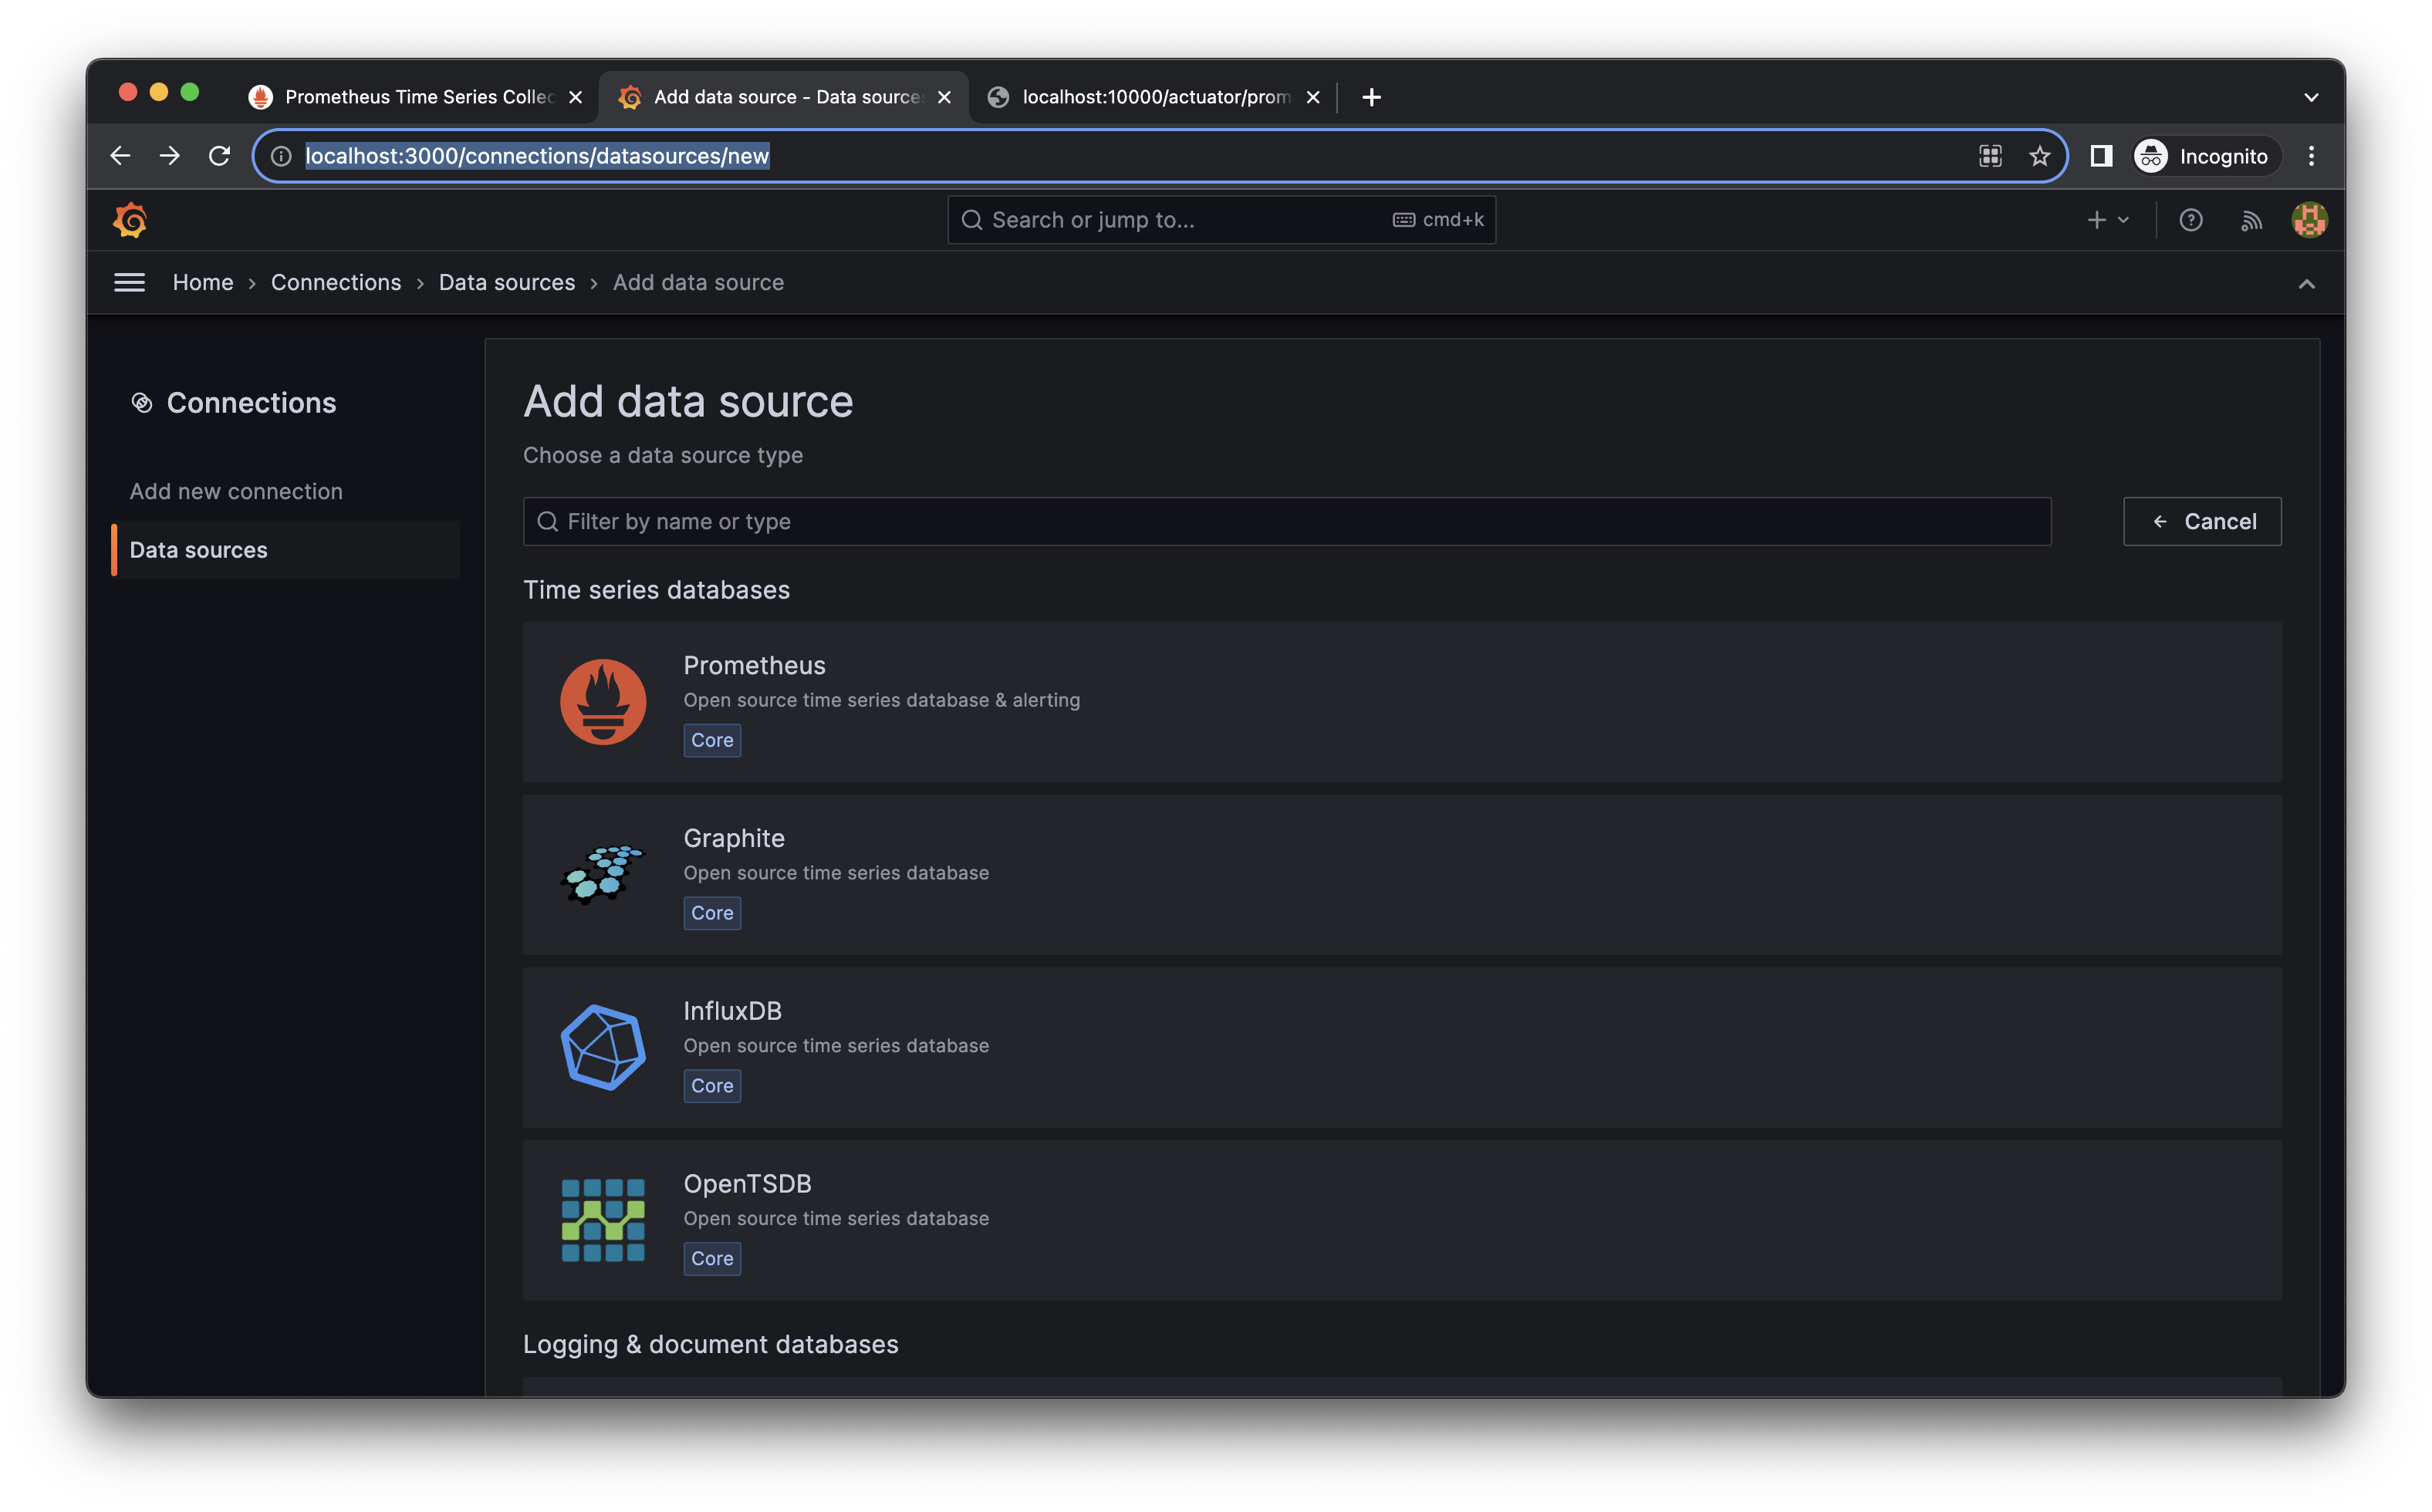
Go to : http://localhost:3000/connections/datasources/new to create a new Datasource and select Prometheus
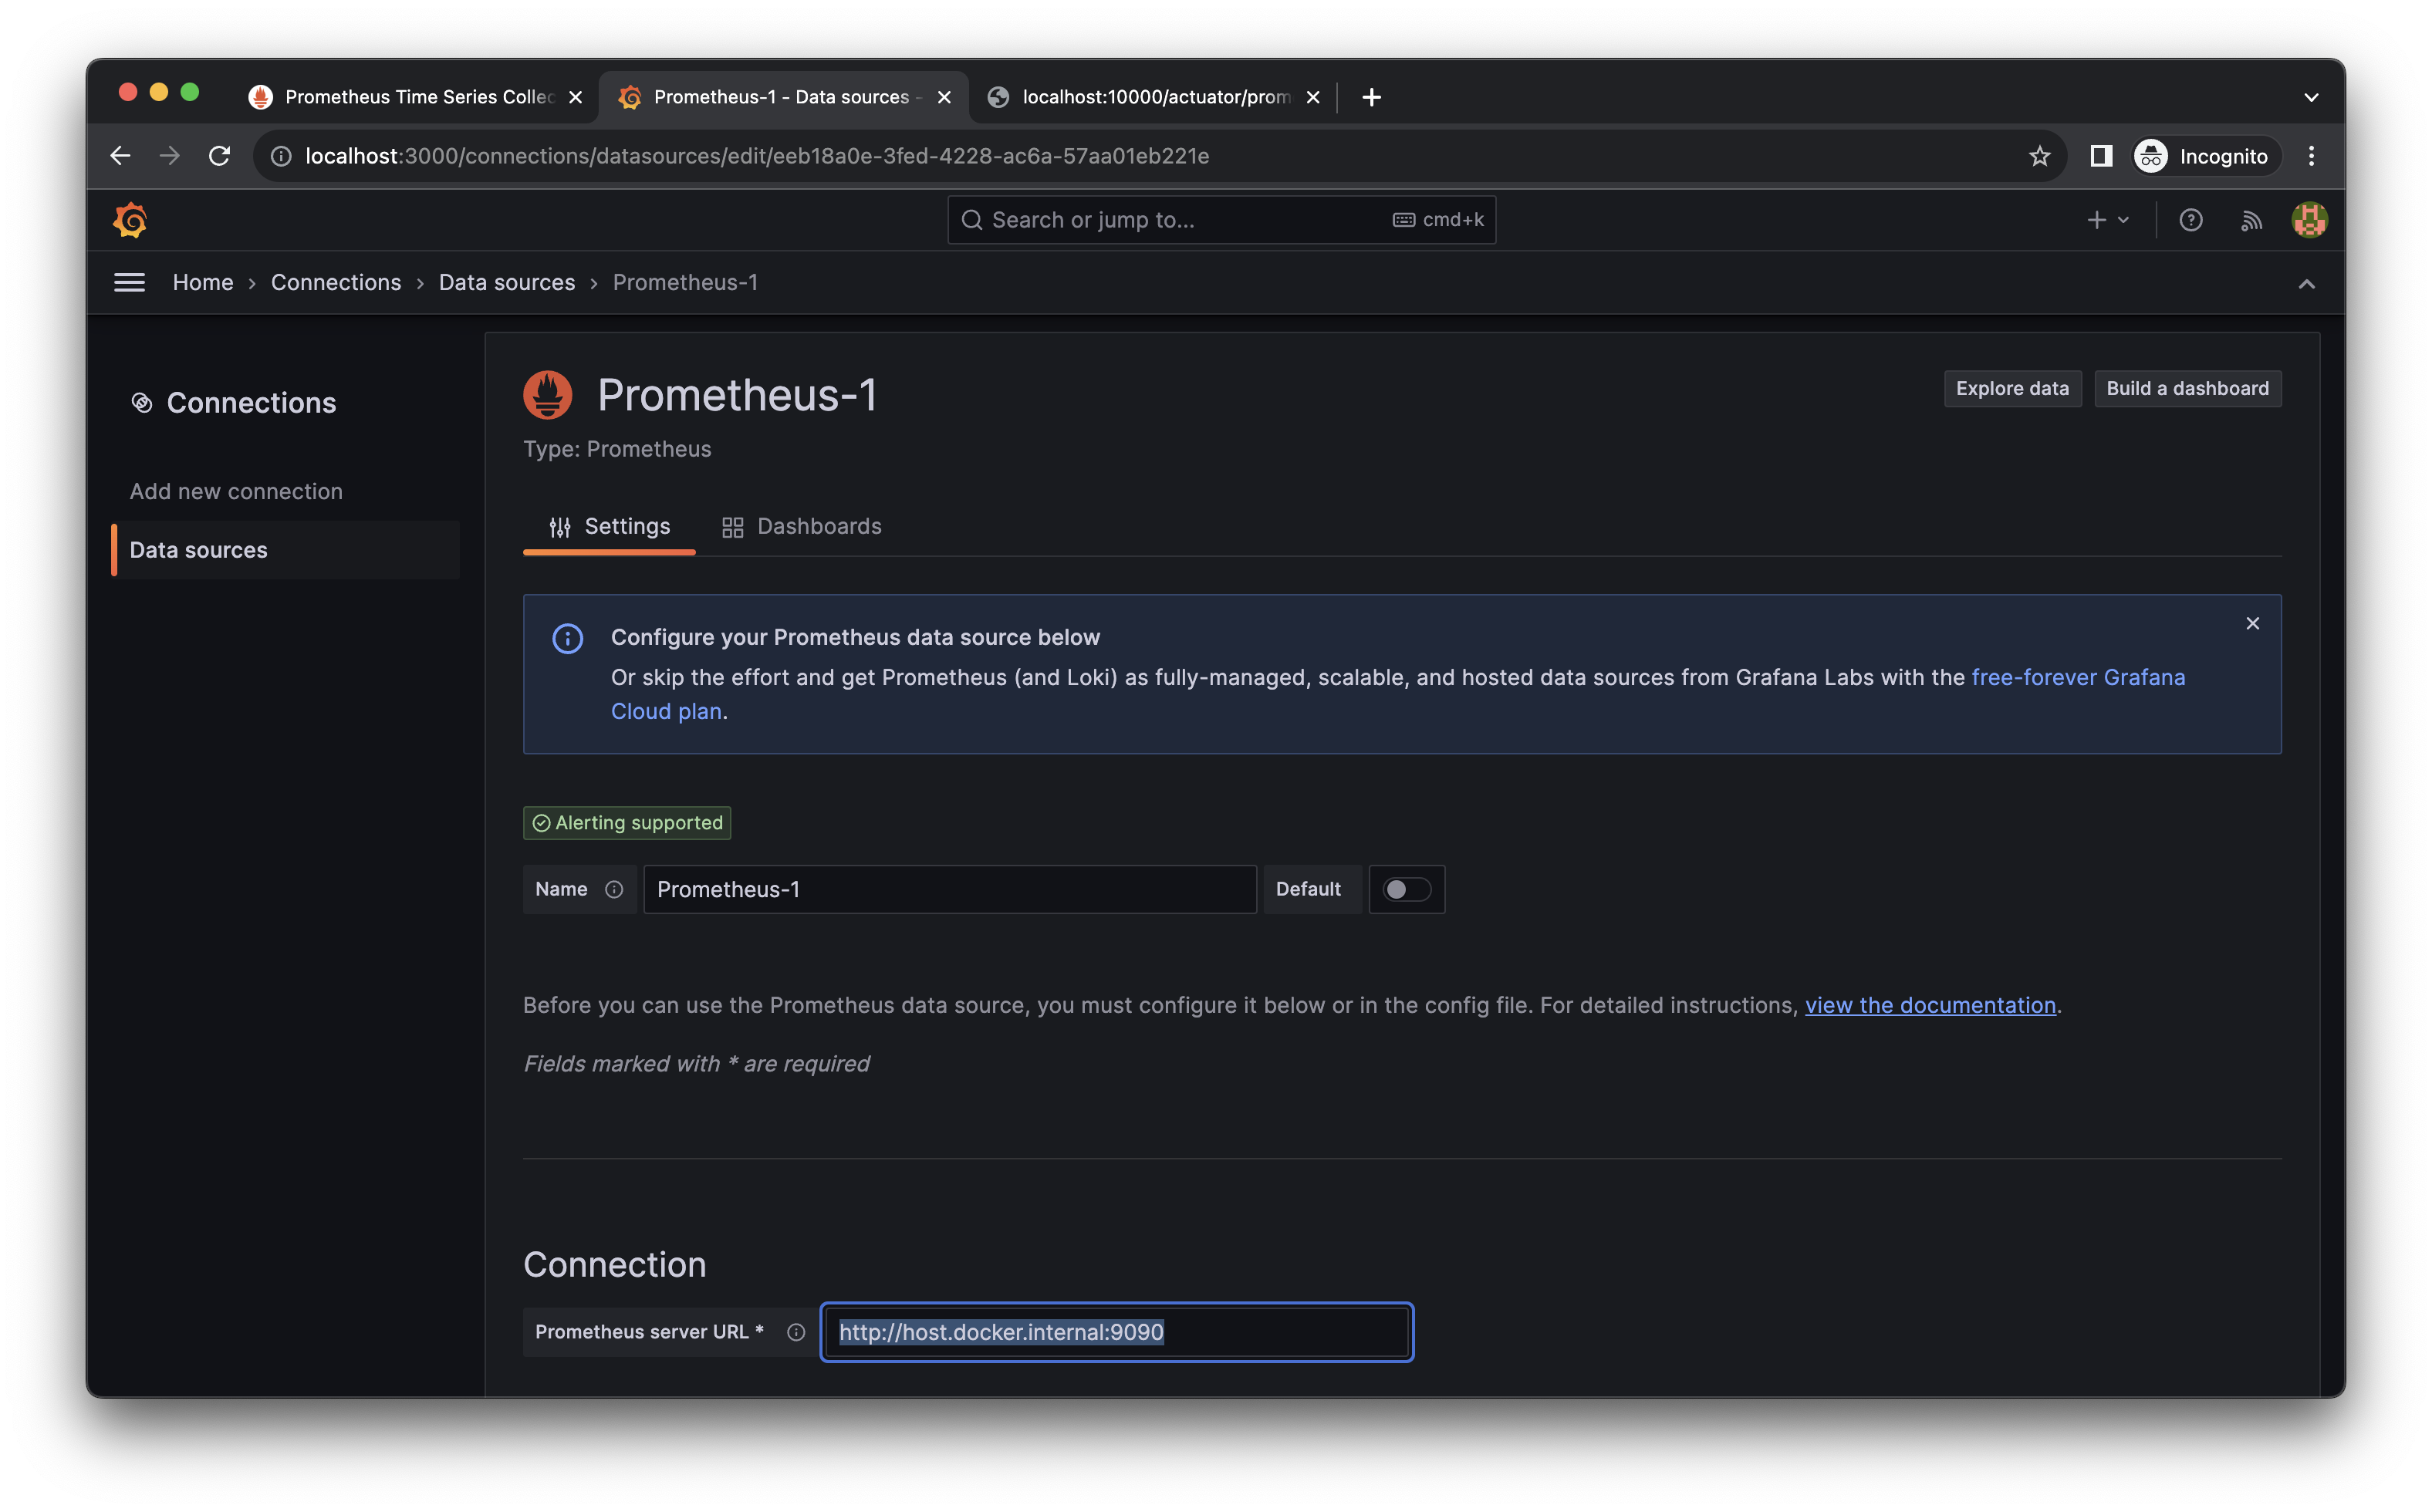
In the Connection section we set the Prometheus server URL to : http://host.docker.internal:9090 (Prometheus url from inside the docker container)
Note: Another clean way to do this is to create a Docker network and add both prometheus and Grafana to it so both containers can communicate.
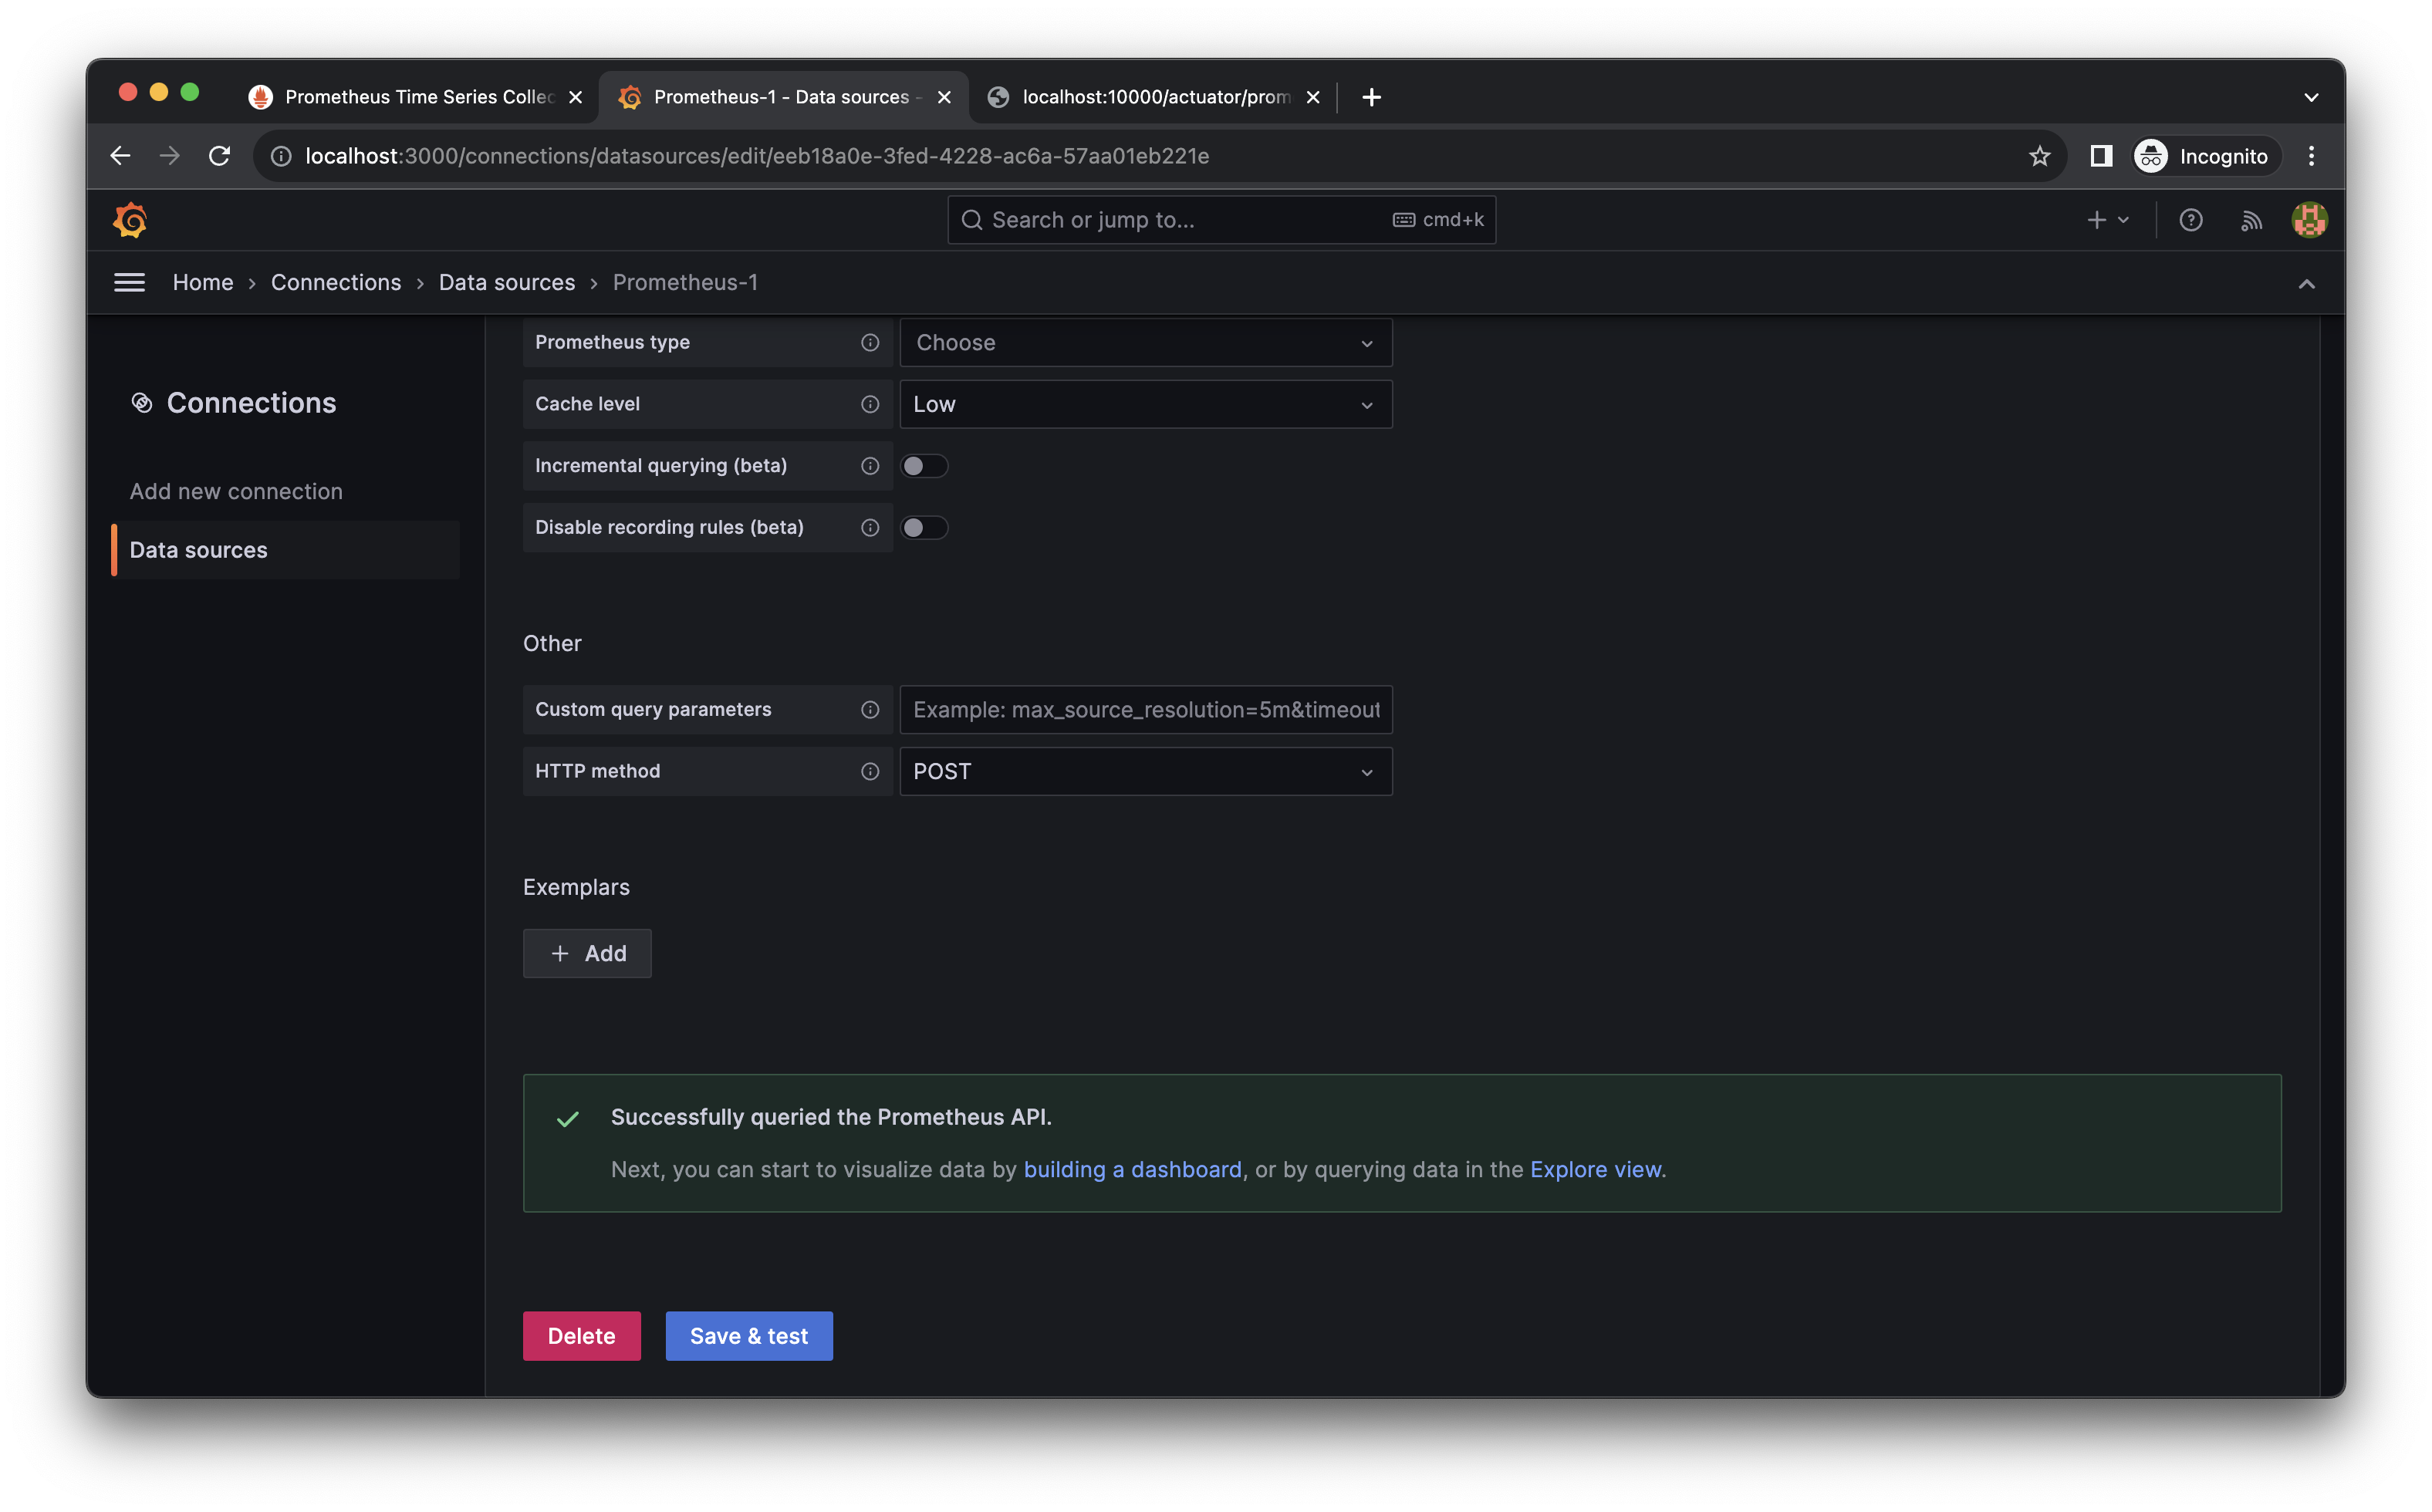
then scroll to end of the page and click on "Save an test", you should see something like this:
After the connection between Grafana and Prometheus is made, we no just need to create our dashboard, for brievty we will import and exisiting dashboard from Grafana.com dashboard library; this one:
https://grafana.com/grafana/dashboards/11378-justai-system-monitor/
Note the url: we will need it.
Adding Spring boot app dashboard to Grafana
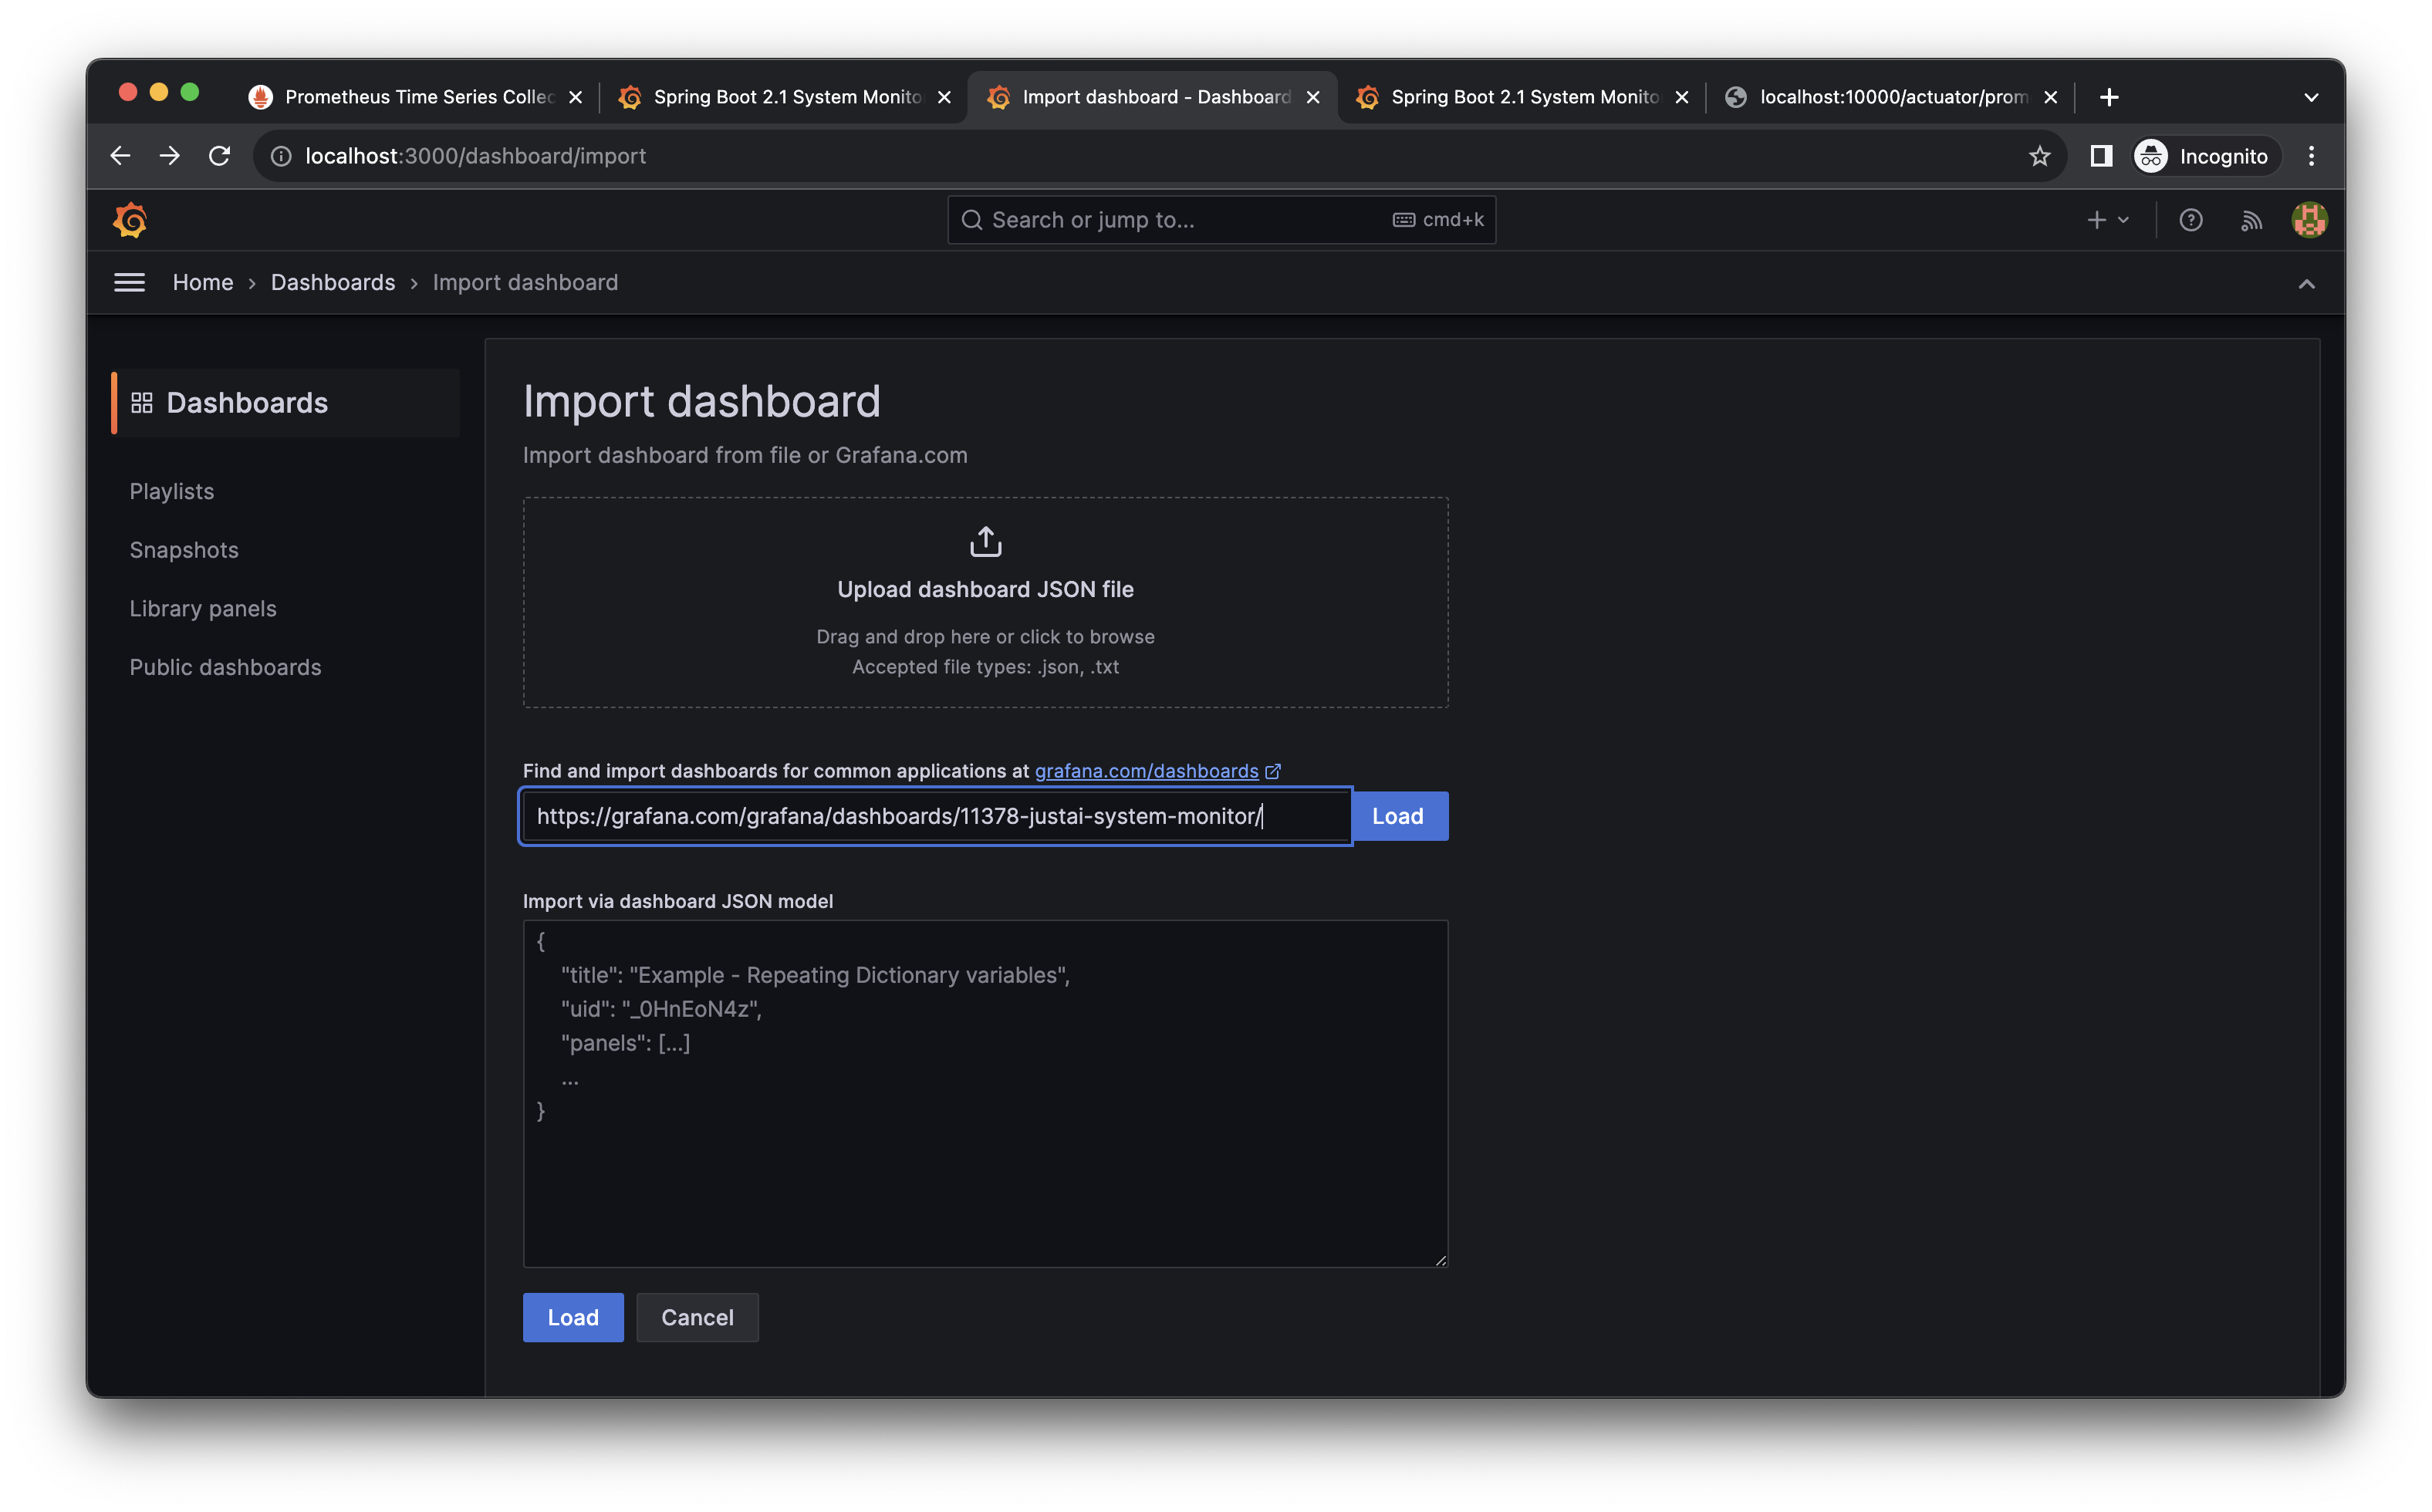
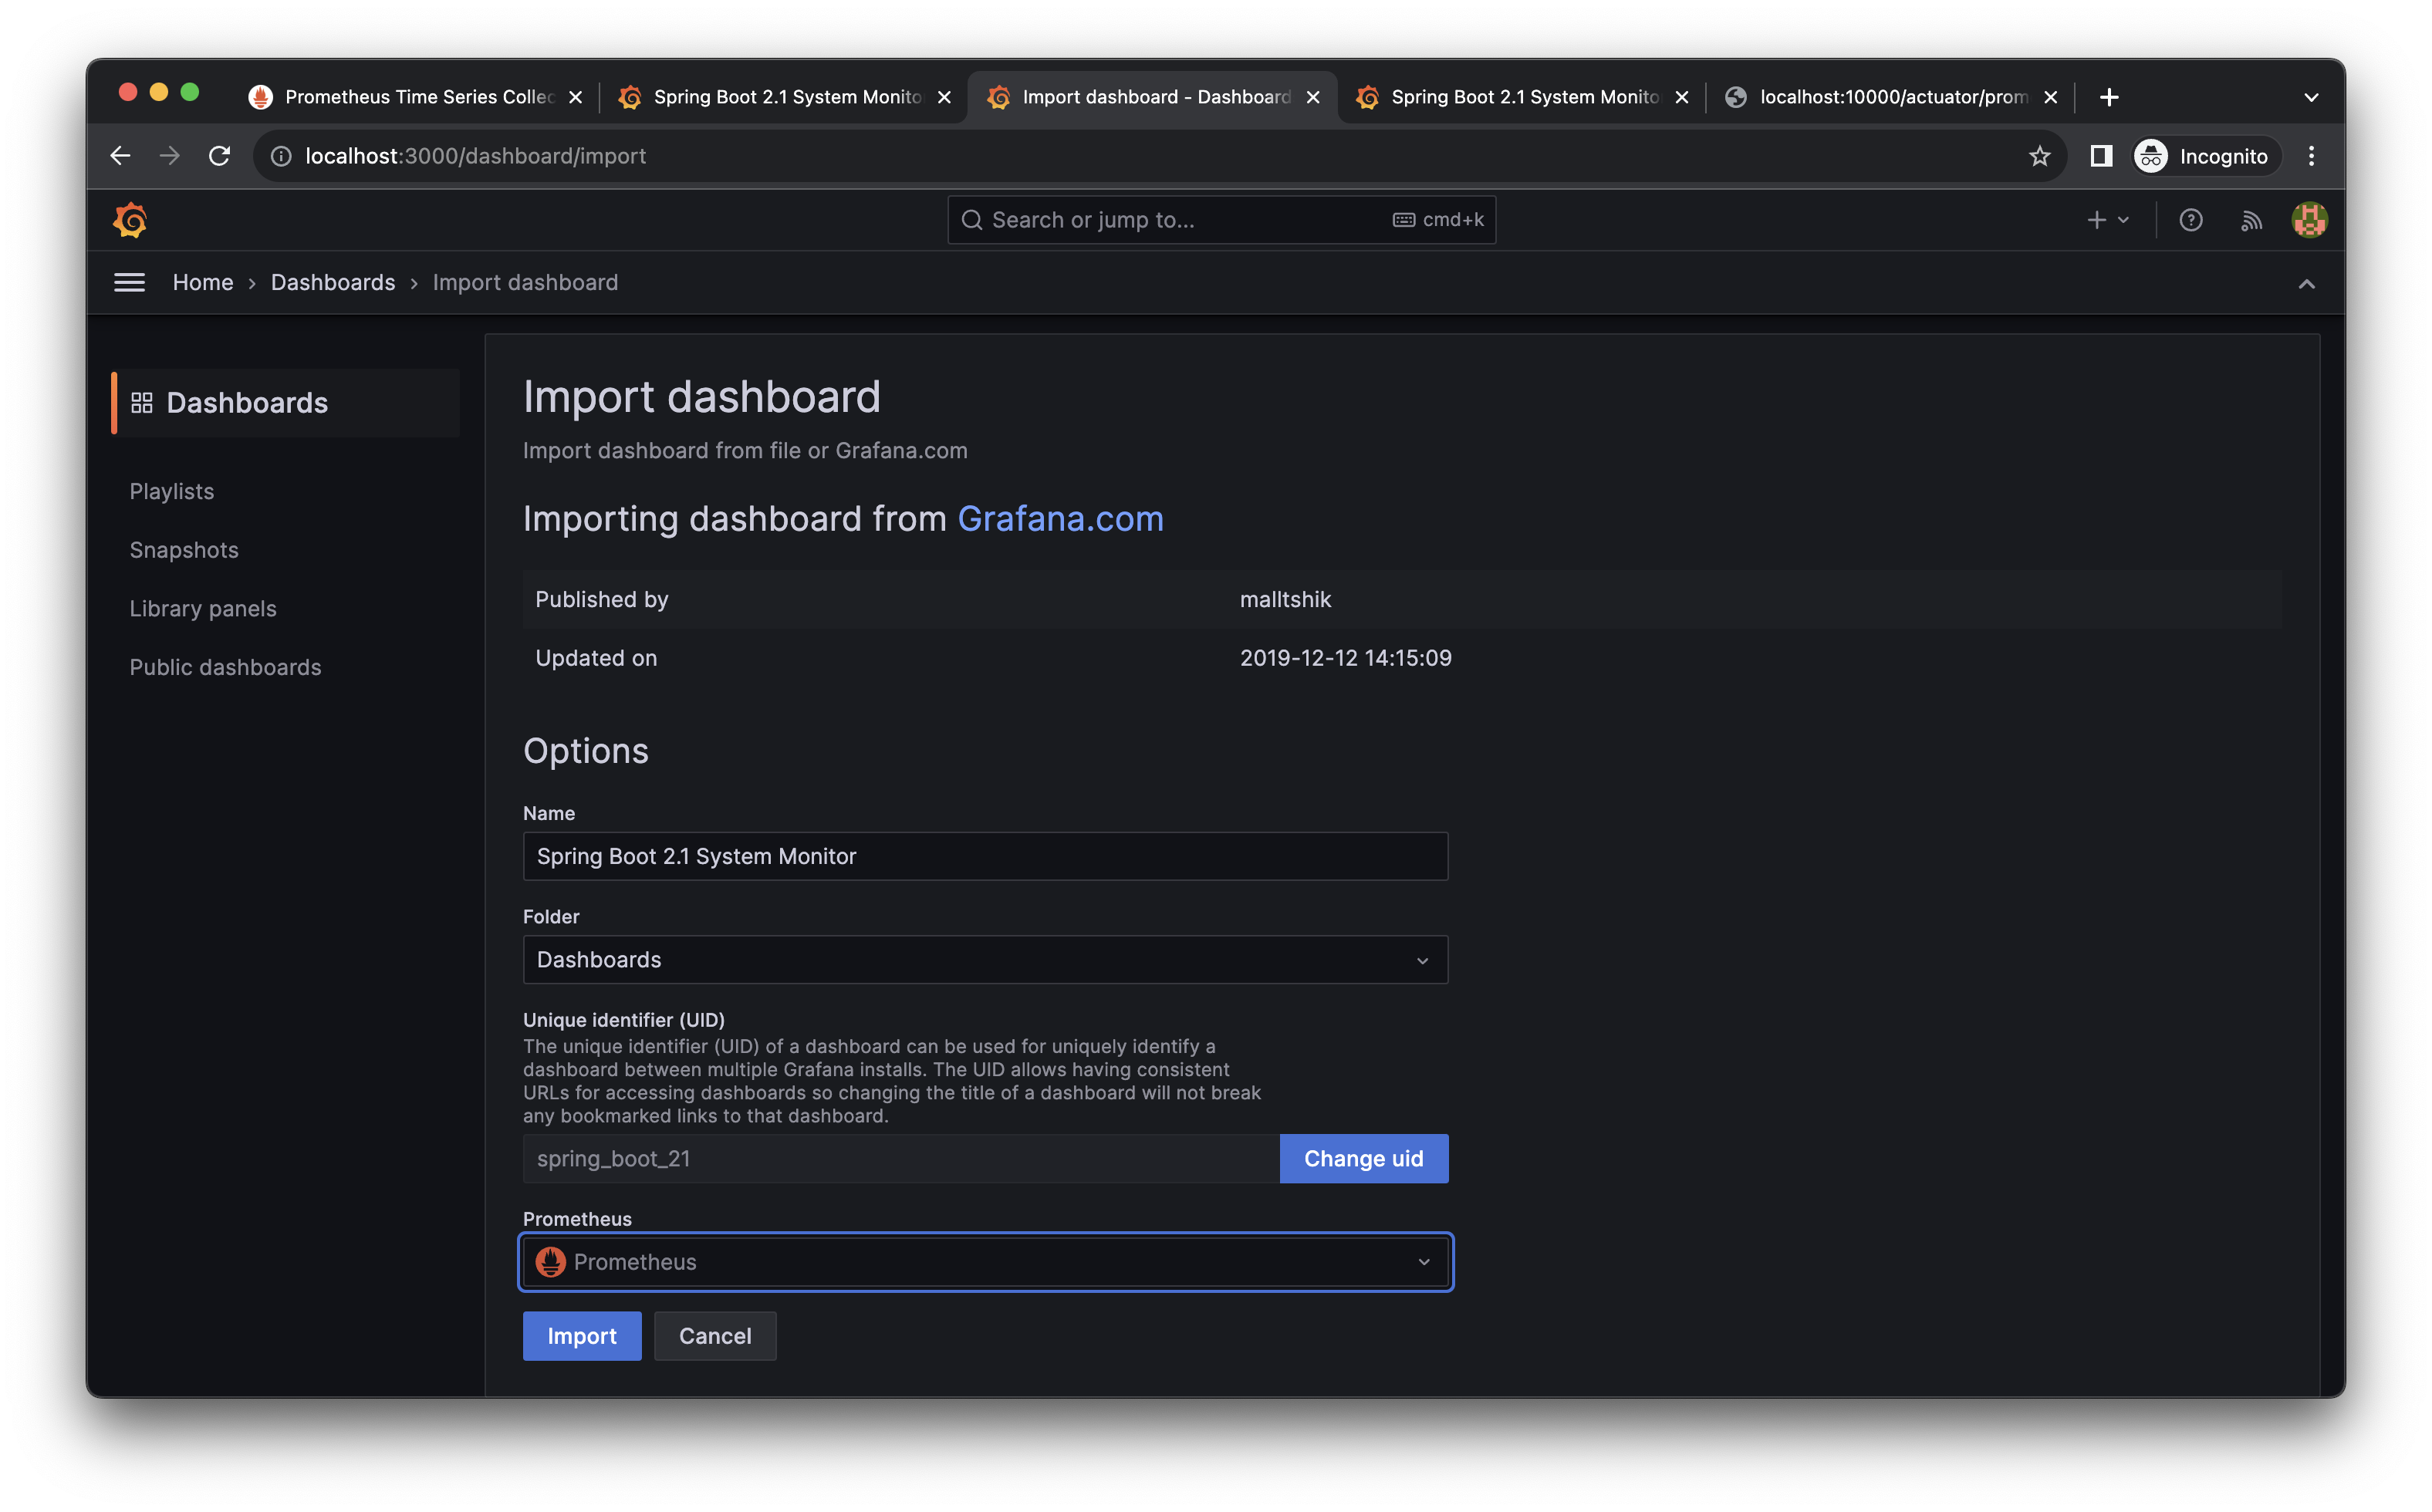
To import the spring boot statistics dashboard we will go to the import page: http://localhost:3000/dashboard/import then paste the grafana.com spring boot dashboard url into the input bar, then click on Load then click on Import
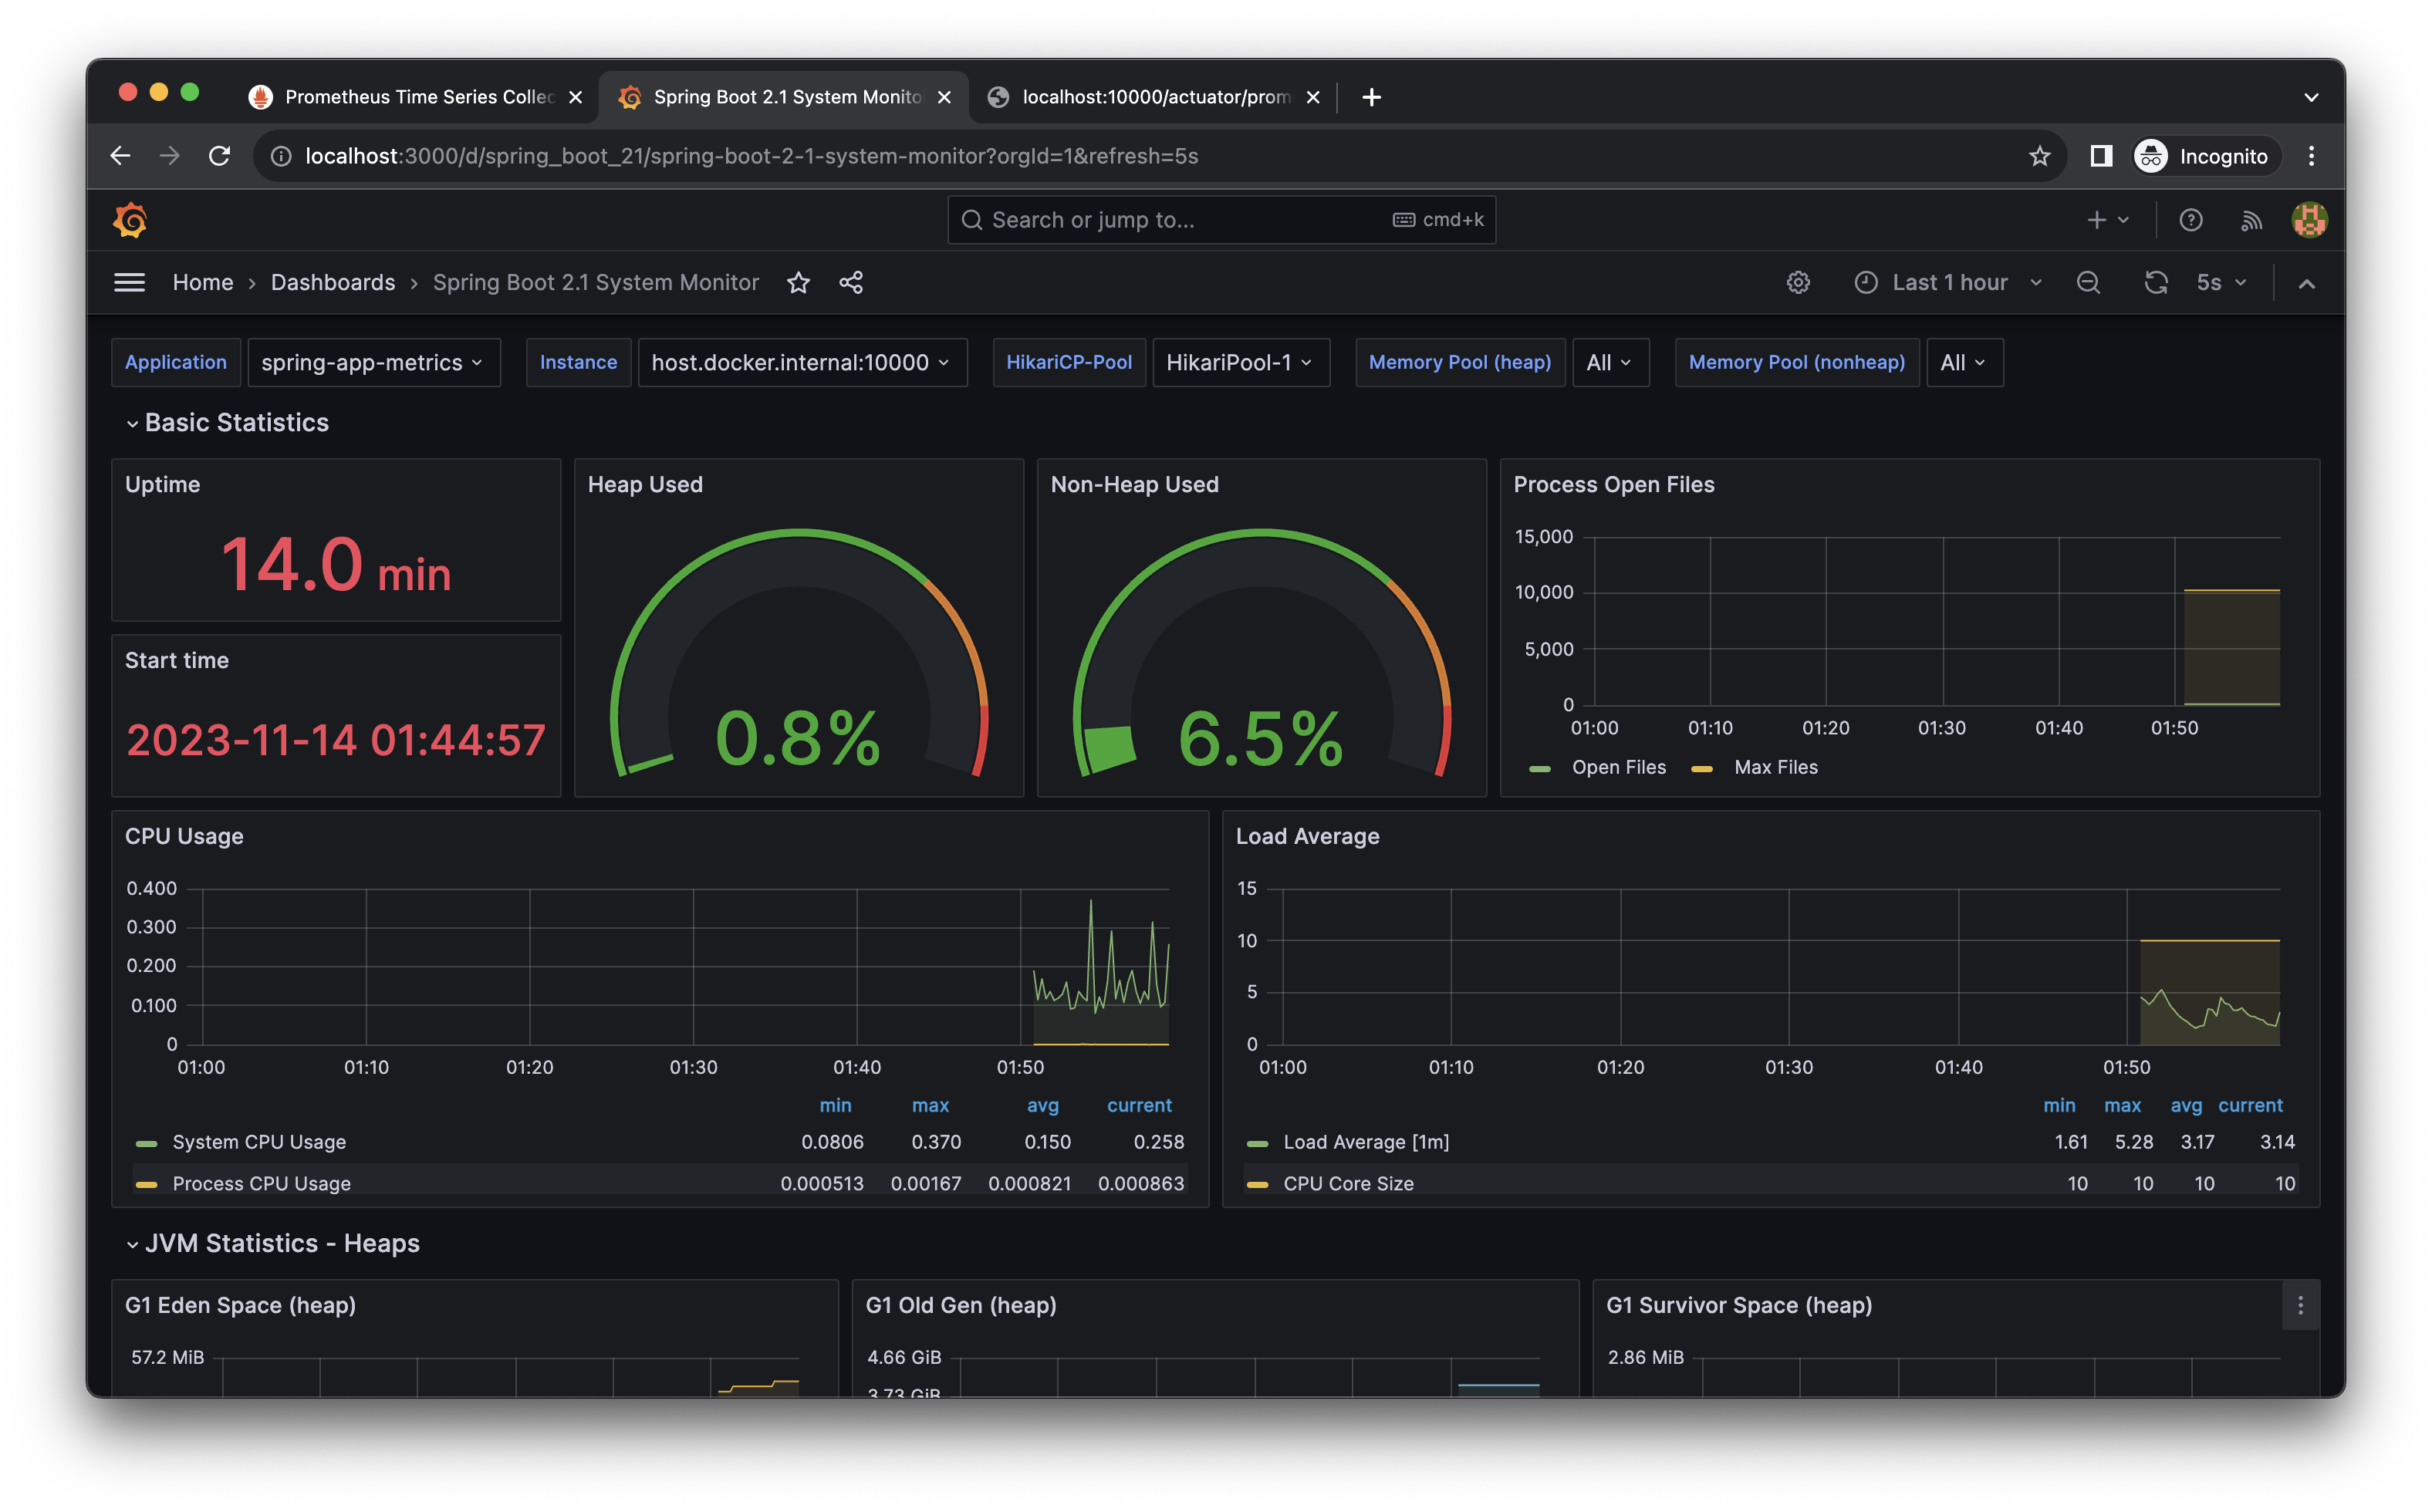
One we click on Import, Grafana will redirect us to the newly imported dashboard
Source code
As always the source code can be found on GitHub ❤️:
https://github.com/camelcodes/spring-boot-prometheus-grafana
Happy Coding !